Map
Genio offers a Map pattern with customization capabilities based on the Visualization modes pattern.
Map subtypes
leaflet-map
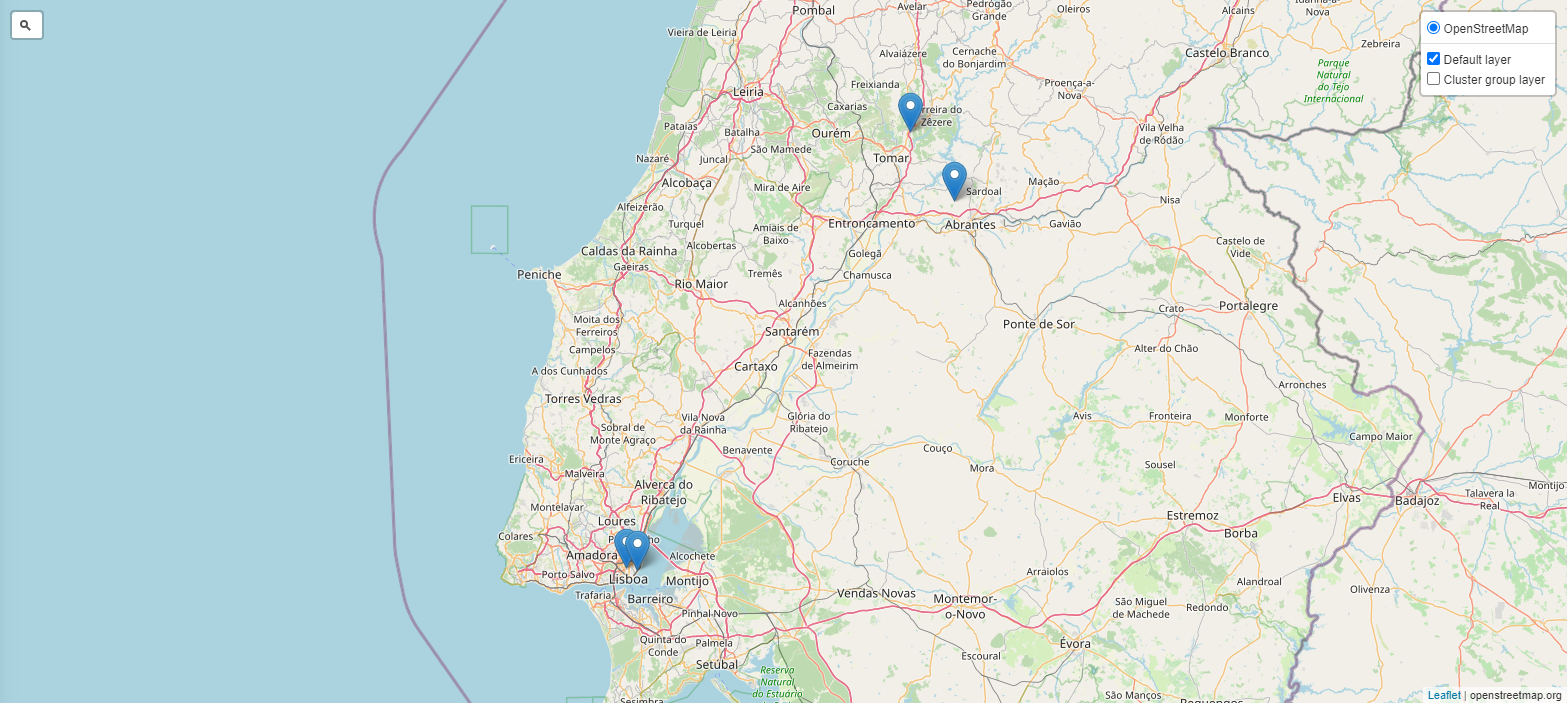
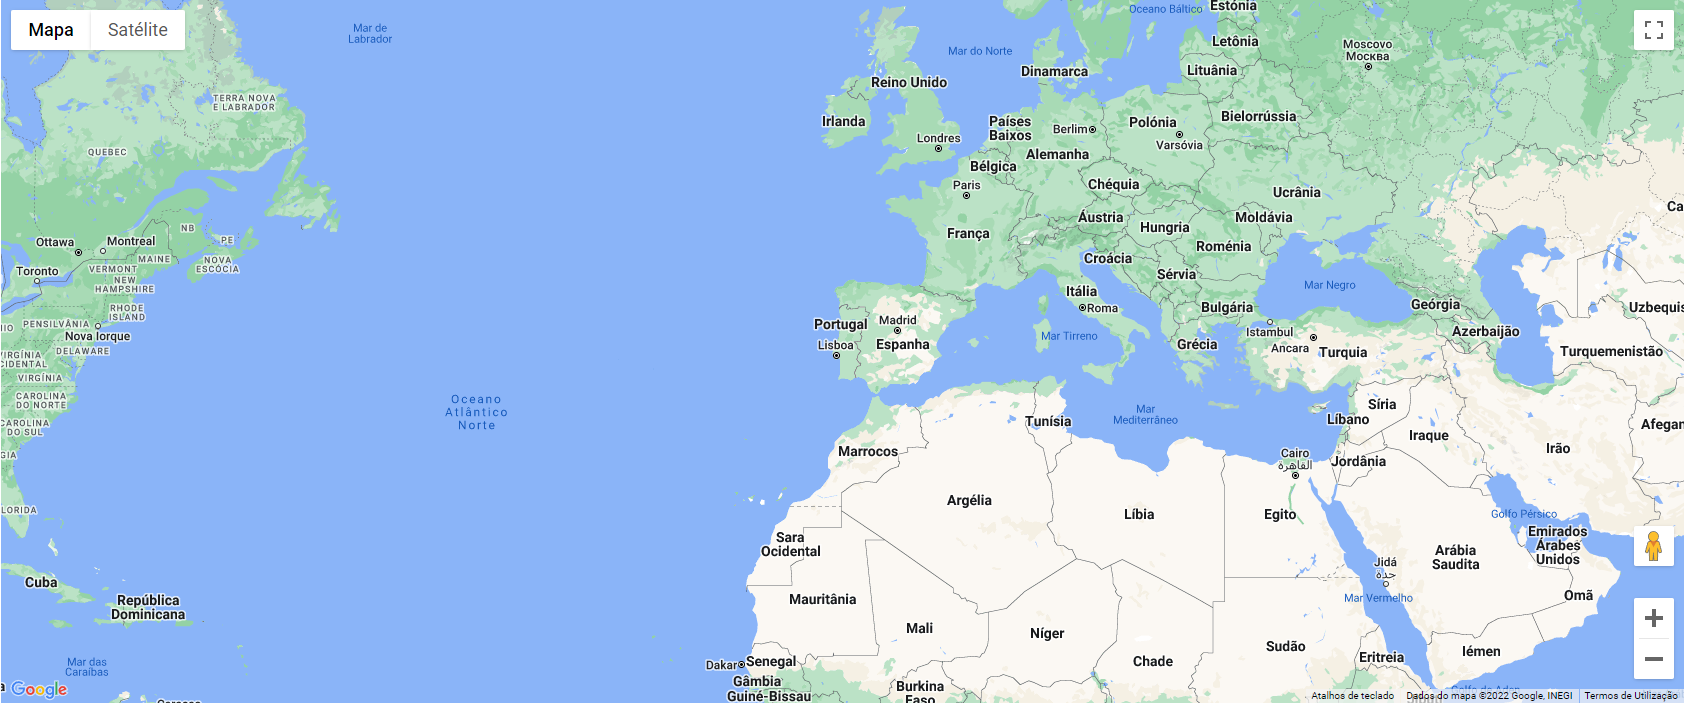
google-map
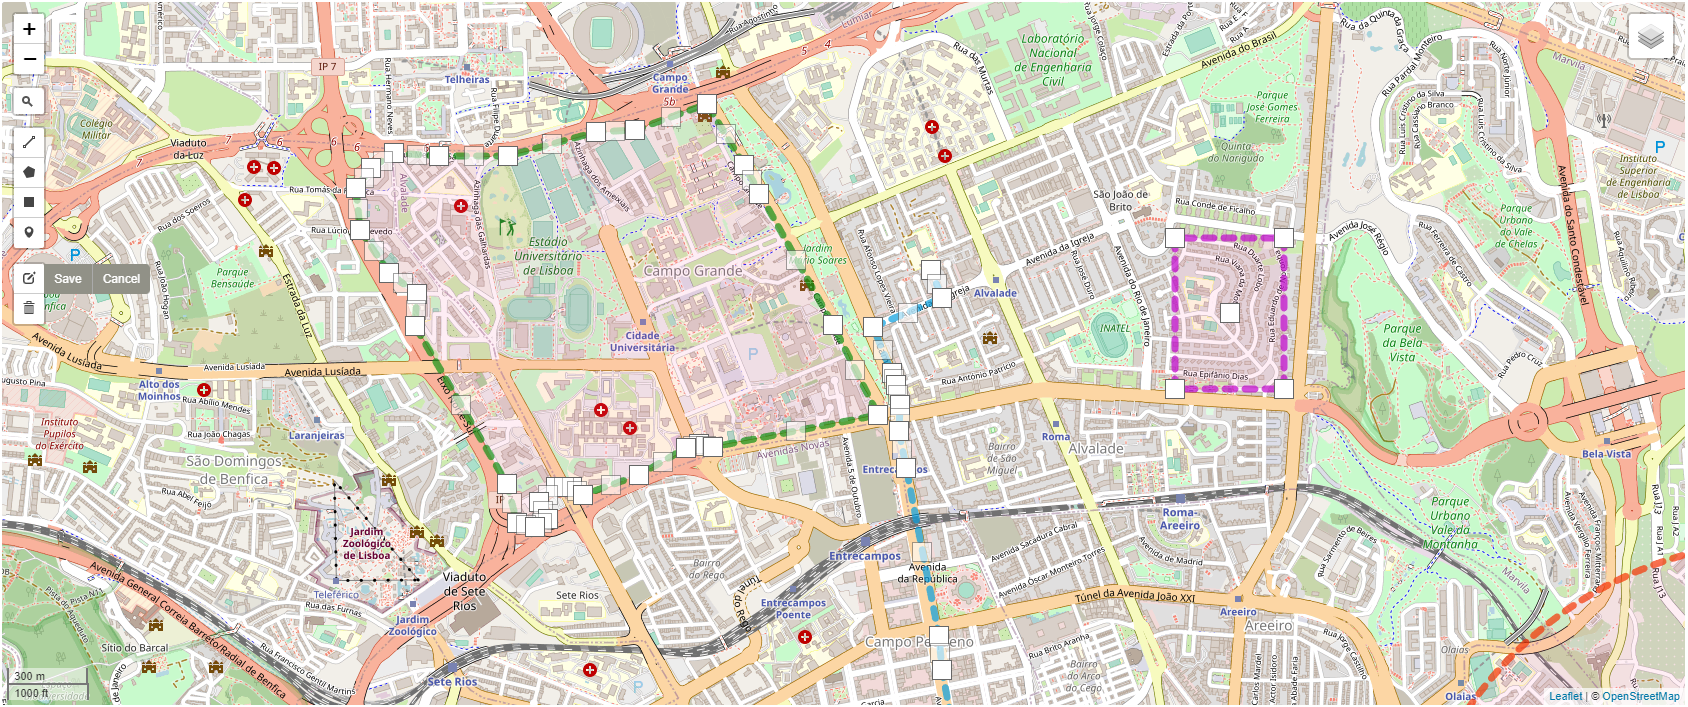
Drawing features
Drawing features can be activated when a Map Visualization mode is used over a Geographic shape or a Geometric coordinates type field.
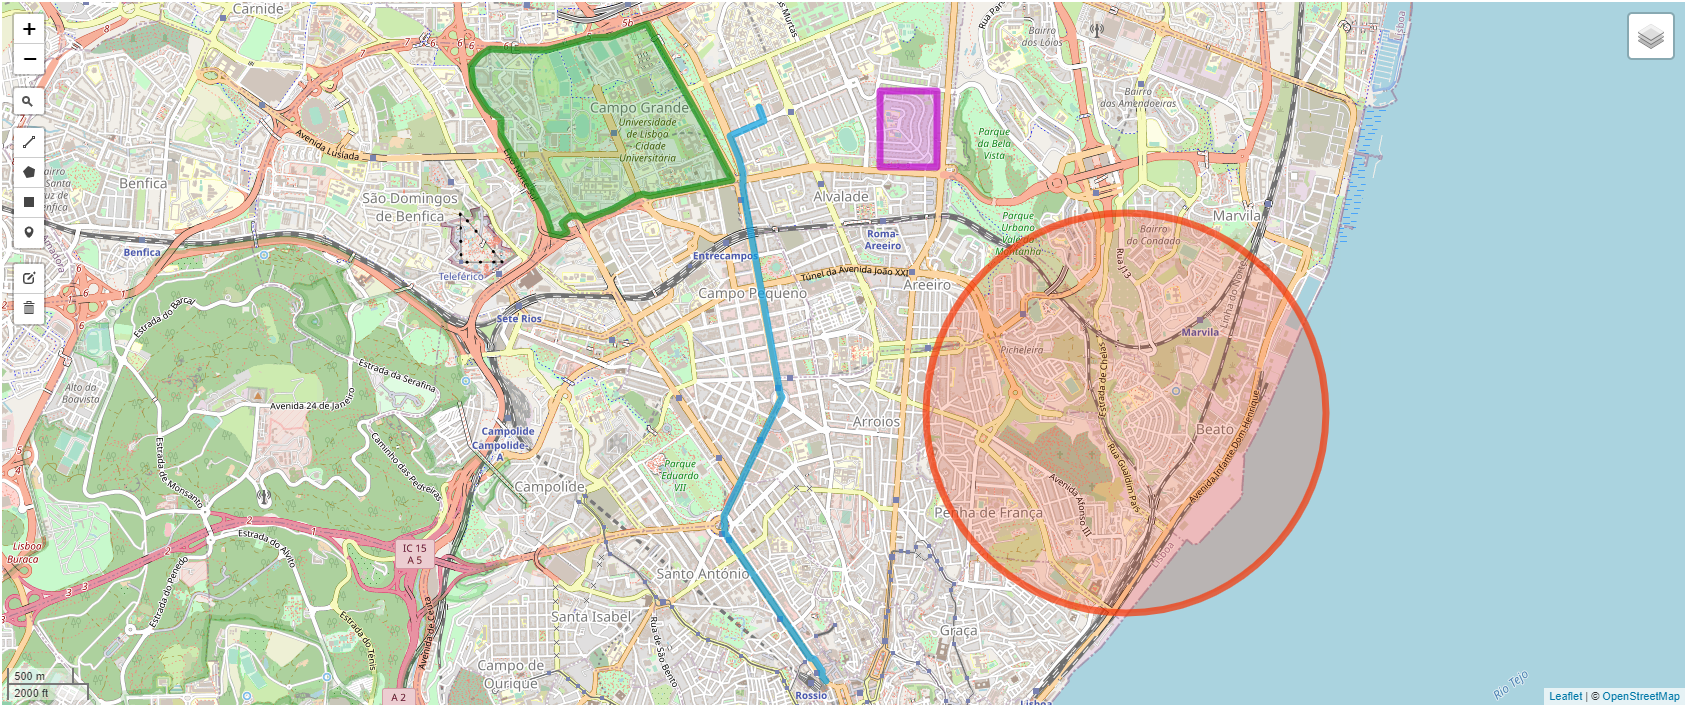
It's also possible to edit or delete the drawn shapes by activating the edit mode.
Choosing the CRS (Coordinate Reference System)
If not specified, the used CRS will be
EPSG:4326
, which is the identifier of WGS84, one of the most common standards, used in most map libraries.
However, if necessary, the CRS can be customized by setting the crs style variable. The value to use for the variable can be either the code of the CRS, if recognized (see list below), or it's full definition using the PROJ.4 nomenclature.
By default, the map already recognizes the following CRS codes:
EPSG:4326EPSG:3857EPSG:4269EPSG:3785EPSG:900913EPSG:102113
If the desired CRS is not on the list, then the full definition can be retrieved from the EPSG website. Just search for the code of the desired CRS, scroll down to the "Export" section and choose the PROJ.4 option, copy the text and set it as the value of the crs style variable.
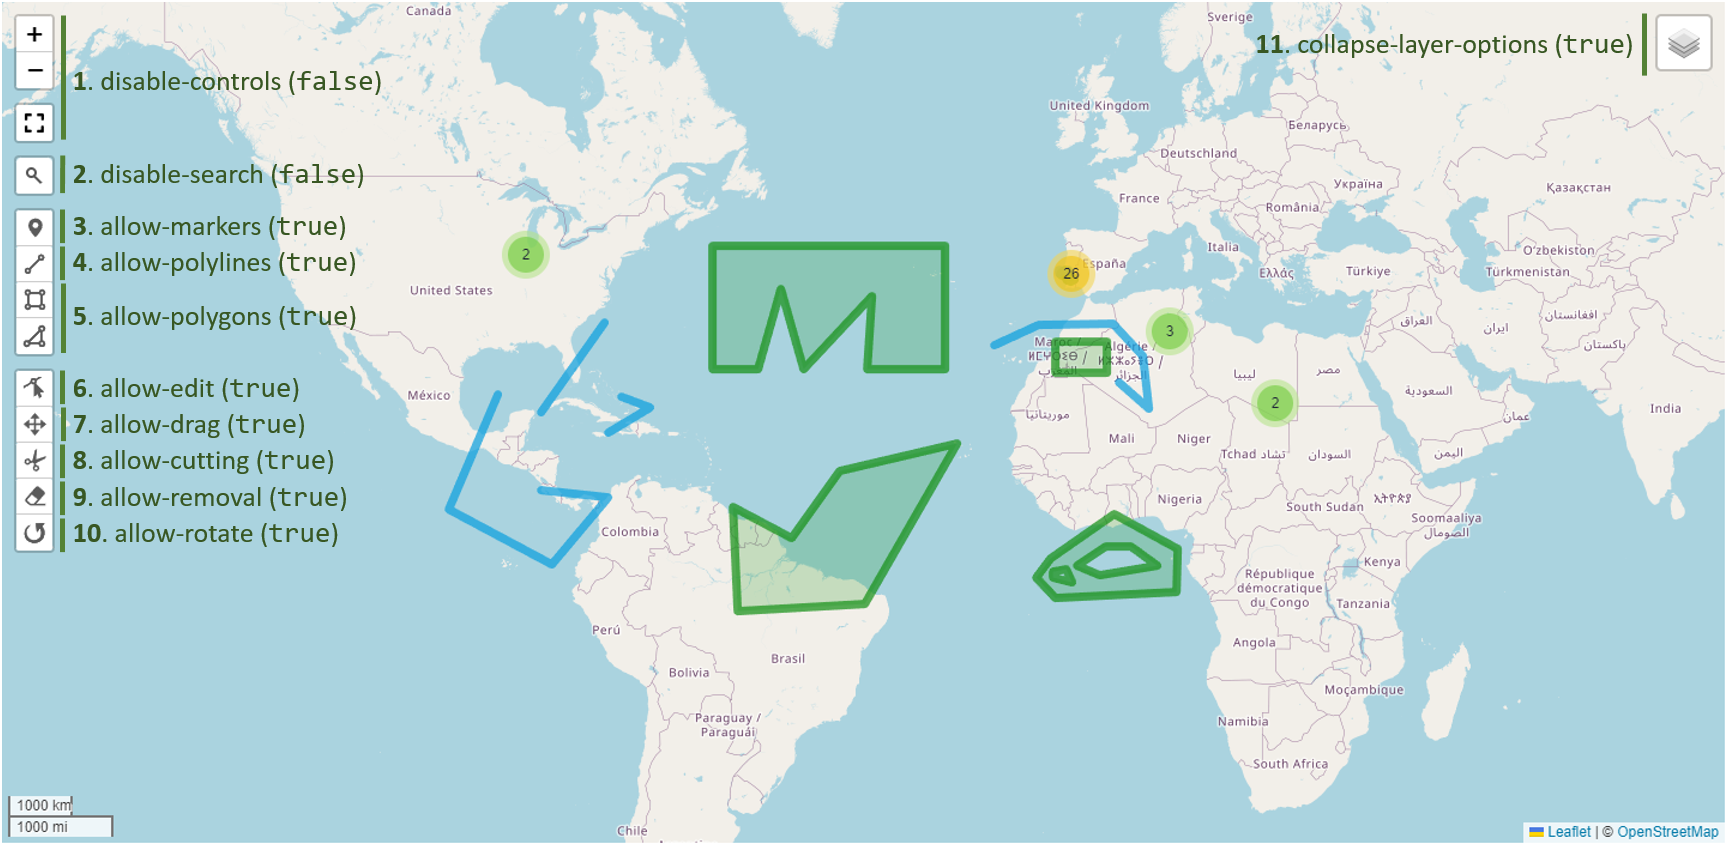
Map configuration
Through the usage of config/style variables, the appearance and available features in the map can be customized. Below, there's an example image of which variable activates/deactivates each of the available features.
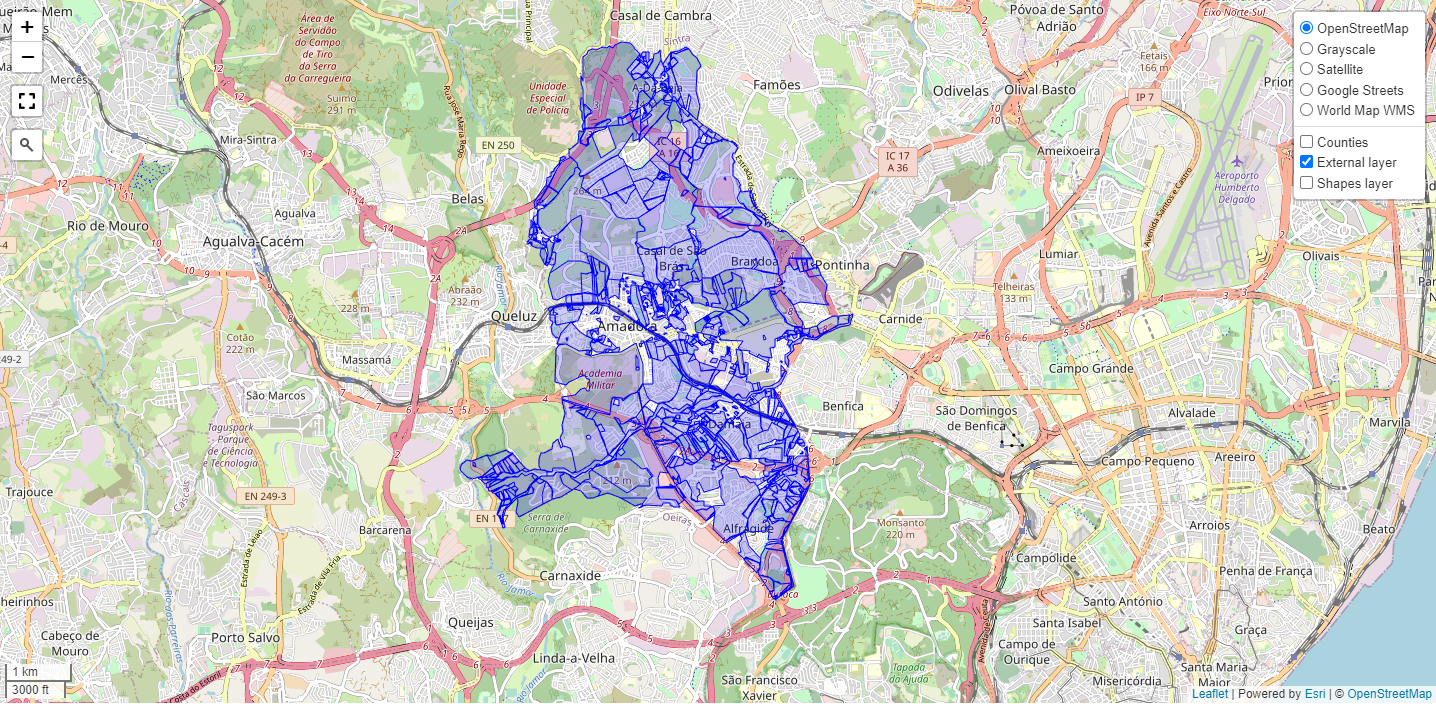
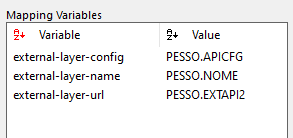
Using layers from external services
Summary
| Name | Type | Description | Mandatory | Allows Multiple Mappings | Admitted Values | Default |
|---|---|---|---|---|---|---|
| geographic-data | Mapping | The data to be displayed on the map. Must be mapped to a geographic field type | () | |||
| marker-description | Mapping | A description of the marker | ||||
| marker-icon | Mapping | The icon that will be displayed on the map to mark the coordinates | ||||
| marker-followup | Mapping | Overrides the followup obtained from the menu structure. Must be mapped to a text field that contains the URL of the target page | ||||
| layer-name | Mapping | A text with the name to give to the map layer, shapes with the same layer name will be grouped | ||||
| polyline-data-color | Mapping | The color of the polylines outline in the current record (will override "polyline-color") | ||||
| polygon-data-color | Mapping | The color of the polygones outline in the current record (will override "polygon-color") | ||||
| circle-data-color | Mapping | The color of the circles outline in the current record (will override "circle-color") | ||||
| legend-item-color | Mapping | Color of legend item. | ||||
| legend-item-description | Mapping | Description of the caption item. | ||||
| allow legend | Style | Add the legend to the map. | true, false |
false |
||
| external-layer-url | Style | A URL to fetch the geographic data from an external API. | ||||
| external-layer-name | Style | A text with the name to give to the layer, in case the data comes from an external API. | ||||
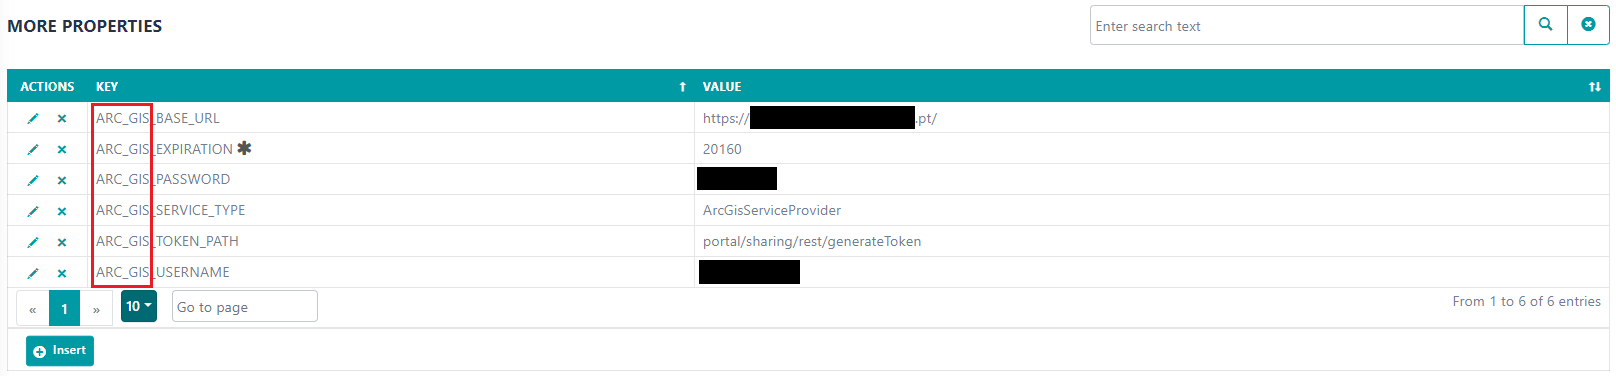
| external-layer-config | Style | An ID for the configuration necessary for the external API (must be defined in the 'more porperties' section of WebAdmin) | ||||
| external-layer-query | Style | A query for which features should be loaded (if not set,all properties will be loaded). | ||||
| external-layer-min-zoom-to-load | Style | A minimum zoom to start loading the data. | ||||
| zoom-level | Style | The initial zoom of the map | 2, 4, 6, 8, 10, 12, 14, 16, 18 |
2 |
||
| min-zoom | Style | The minimum zoom allowed (can't be less than 0). | ||||
| max-zoom | Style | The maximum zoom allowed (shouldn't be more than 18, most tile layers won't support anything beyond that point). | ||||
| zoom-with-ctrl | Style | Whether or not users need to keep the "Ctrl" key pressed in order to change the zoom using the mouse wheel. | true, false |
true |
||
| fit-zoom | Style | Whether or not to fit the zoom so all the available markers become visible | true, false |
true |
||
| zoom-delta | Style | Property that controls the variation (increment or decrement) of the map's zoom level when interacting with the zoom control. | 0.1, 0.2, 0.3, 0.4, 0.5, 0.6, 0.7, 0.8, 0.9, 1 |
? |
||
| bound-south-west | Style | The southern-westmost point that can be visible on the map (must be used together with 'bound-north-east') | ||||
| bound-north-east | Style | The northern-eastmost point that can be visible on the map (must be used together with 'bound-south-west') | ||||
| disable-search | Style | Whether or not to disable the search of the map | true, false |
false |
||
| disable-controls | Style | Whether or not to disable the controls of the map | true, false |
false |
||
| center-coord | Style | The initial coordinates where to center the map | POINT(0 0) |
|||
| show-sources-in-description | Style | Whether or not to show the name of the source (the label of either the form field or the column) in the description of the marker | true, false |
false |
||
| collapse-layer-options | Style | Whether or not to collapse the container to choose the layer | true, false |
false |
||
| crs | Style | The CRS of the coordinates (should be either a known EPSG code or a PROJ.4 definition) | EPSG:4326 |
|||
| map-height | Style | The height of the map | 75vh |
|||
| allow-markers | Style | Whether or not markers can be drawn on the map | true, false |
true |
||
| allow-polylines | Style | Whether or not polylines can be drawn on the map | true, false |
true |
||
| allow-polygons | Style | Whether or not polygons can be drawn on the map | true, false |
true |
||
| allow-edit | Style | Whether or not shapes can be edited | true, false |
true |
||
| allow-drag | Style | Whether or not shapes can be dragged | true, false |
true |
||
| allow-cutting | Style | Whether or not shapes can be cut | true, false |
true |
||
| allow-removal | Style | Whether or not shapes can be removed | true, false |
true |
||
| allow-rotate | Style | Whether or not shapes can be rotated | true, false |
true |
||
| shape-outline-weight | Style | The thickness of the shapes border/outline | 7 |
|||
| polyline-color | Style | The color of the polylines outline | #079ede |
|||
| polygon-color | Style | The color of the polygons outline | #118f13 |
|||
| circle-color | Style | The color of the circles outline | #f53505 |
|||
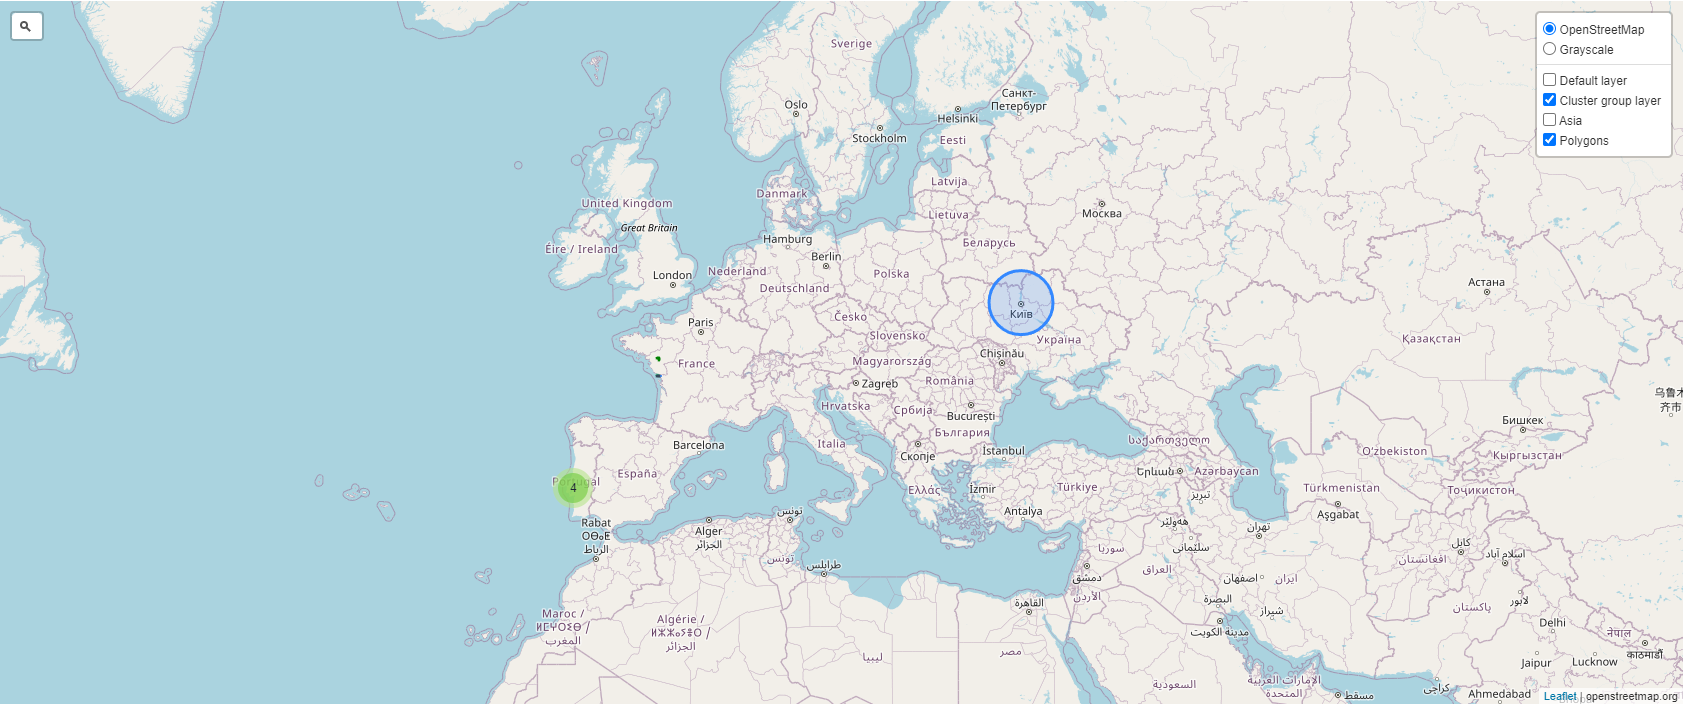
| group-markers-in-cluster | Style | Whether or not markers will be grouped in clusters | true, false |
true |
||
| allow-exporting | Style | Whether or not the currently displayed map can be saved as an image file | true, false |
true |
||
| allow-center-control | Style | Control to center data on the map | true, false |
true |
||
| background-overlay | Style | The background overlay that will appear active by default | OpenStreetMap, Grayscale, Satellite |
OpenStreetMap |
||
| open-popup-on-hover | Style | The map popup will appear when hovering a shape | true, false |
true |
(): Will only be mandatory in tables, in geographic/geometric fields from the database the value will be implicitly mapped.
Changelog
The complete changelog of all notable changes made to Visualization modes - Maps. Descriptions are written as New: or Fixed: for changes that are not considered a maintenance release.
Genio 325.99
- (VUE) Fixed: Fixed dynamic style variables used in Maps not updating unless the user refreshed the form.
Genio 325.98
- (VUE) Fixed: Improvements to the performance of Maps when a user is adding, removing or editing shapes.
Genio 325.97
- (VUE) Fixed: Fixed, in Maps, the popup with extra info not appearing, when a marker/shape was clicked, if the fullscreen mode was active.
Genio 325.77
- (VUE) Fixed: Fixed, in maps, the coordinates being displayed in a wrong coordinate system when a marker/shape was clicked.
Genio 325.76
- (VUE) Fixed: Fixed Map center not dynamically updating when the user changed a dependency.
Genio 325.75
- (VUE) Fixed: Fixed description of markers/shapes not showing on the Map.
Genio 325.74
- (VUE) New: Added "Rotate", "Cut" and "Drag" features to Leaflet maps.
Genio 325.63
- (VUE) New: Added new style variables to further customize Maps.
Genio 325.56
- (VUE) Fixed: Fixed search in Map when geometric coordinates are being used.
Genio 325.31
- (VUE) Fixed: Fixed geographic type fields (Maps) not reacting to changes.
Genio 323.84
- (VUE) Fixed: Fixed, in maps, the conversion of coordinates shown in the popup when a marker was clicked.
Genio 323.74
- (VUE) New: Added support for all SRID types in Maps.
Genio 321.79
- (VUE) Fixed: Fixed loading of maps when the "disable-controls" style variable isn't set.
Genio 321.20
- (VUE) New: Leaflet Maps will now only zoom if the user is pressing the Ctrl key.
Genio 320.50
- (VUE) New: Added fullscreen feature to Leaflet maps.
Genio 320.29
- (VUE) New: Shapes used in leaflet maps are now taking into account whether or not they have icons mapped in "marker-icon" variable.
Genio 319.84
- (VUE) New: When a leaflet map is loaded, the zoom and center are adjusted so all the markers and shapes become visible.
Genio 319.71
- (VUE) New: In leaflet maps, clicking on a shape now opens a popup with it's information, just like it did with normal markers.
Genio 319.54
- (VUE) New: In maps, layers with the same name are now grouped.
Genio 319.26
- (VUE) New: Added support for more complex geographic data types, like MULTIPOLYGON and MULTIPOLYLINE.
Genio 318.01
- (VUE) New: Added drawing capabilities to Leaflet Maps.
Genio 317.19
- (VUE) New: Added "Grayscale" as a new default overlay for Leaflet Maps and a new style variable "collapse-layer-options" to customize the layer options container.
Genio 315.16
- (VUE) Fixed: Fixed marker clusters in Leaflet maps.
Genio 315.11
- (VUE) Fixed: Fixed maps not working when they were inside tabs or collapsible groups.
Genio 314.80
- (GEN) Fixed: Fixed Visualization modes not validating, in some cases, if all the required variables were being mapped to.
Genio 314.79
- (VUE) New: Added new style variables to Map's Visualization mode, to allow greater customization of the marker's info window.
Genio 314.72
- (VUE) Fixed: Fixed insertion of new markers, in leaflet maps, when the "marker-description" variable was left empty.
Genio 314.64
- (GEN) Fixed: Fixed mapping variables having an empty value in Visualization modes over DB fields.
Genio 314.62
- (VUE) Fixed: Fixed problems with saving markers in leaflet maps.
Genio 314.61
- (VUE) New: Added support for style variables in leaflet maps.
Genio 314.05
- (VUE) New: Improvements to the map components (Leaflet and Google maps), added support for single coordinate fields.
Genio 312.49
- Initial build