Dashboard
Genio has built-in support for dashboard pages. A dashboard gives users one place to see what needs their attention, follow key indicators and reach the screens they use most, arranged the way they prefer. The dashboard pattern is offered as a menu followup and can be set as the homepage of a module.
Topics
See also
-
Special renderings
Overview
A dashboard is made of widgets: alerts, shortcuts to menus, the user's favorites, and custom widgets that can display any form, such as a chart or a list of records. The developer decides which widgets are available; each user then adds, removes and moves widgets to build their own workspace.

Benefits
- Users start their work faster. Their priorities are on the first screen, instead of several menus away.
- Pending work is always visible. Alert widgets show how many records need attention, so nothing slips through.
- One click to act. Alert widgets, and custom widgets with lists, open the related table and records automatically.
- Fewer clicks for daily tasks and quick actions. Menu widgets and lists of recent records replace long paths through the menu.
- Users build their own workspace. Adding, removing and moving widgets gives users a sense of control, which increases adoption.
- Any form can become a widget. Custom widgets render a form inside the dashboard, including visualization modes as chart, map, calendar, list or other.
Widgets
The dashboard pattern is accompanied by a set of pre-prepared widgets, such as alert, favourites, menu and custom widgets.
To meet more complex needs, such as chart widgets, a custom widget type is offered, which allows forms to be rendered within the dashboard as widgets. The dashboard pattern currently support the following pre-prepared widgets:
Alert widgets
Alert widgets are based on the existing Genio alerts. The color and icon follows the alert definition. They show the alert's title and the number of matching records. Clicking the widget opens the related table and records.
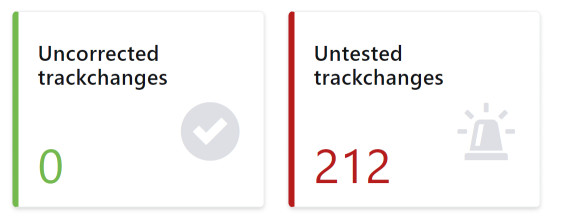
Existing alerts can easily be added to the dashboard configuration. However, an alert can only be added to the dashboard configuration if its "Does not generate if" option is disabled. This prevents widgets with no data to be displayed from being added to the dashboard.
Favourites widgets
Favourites widgets let users place their favourite pages on the dashboard. Removing a favourite also removes its widget from the list of available widgets.
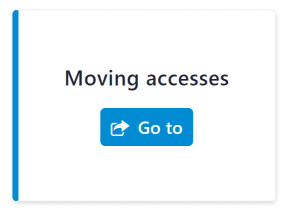
Menu Widgets
Menu widgets are shortcuts: a title and a button that opens a menu of the application. Use them for the screens users open every day and for quick, repetitive tasks. Optionally enable the Render submenus setting to automatically display all submenus of the selected menu. If the menu entries have associated icons, these are displayed automatically in the widget.
Custom widgets
As previously described, custom widgets allow the rendering of forms in the dashboard, providing the flexibility required to build the most complex widgets.
Here is an example of a widget that contains a chart, which was built by composing different Genio patterns.
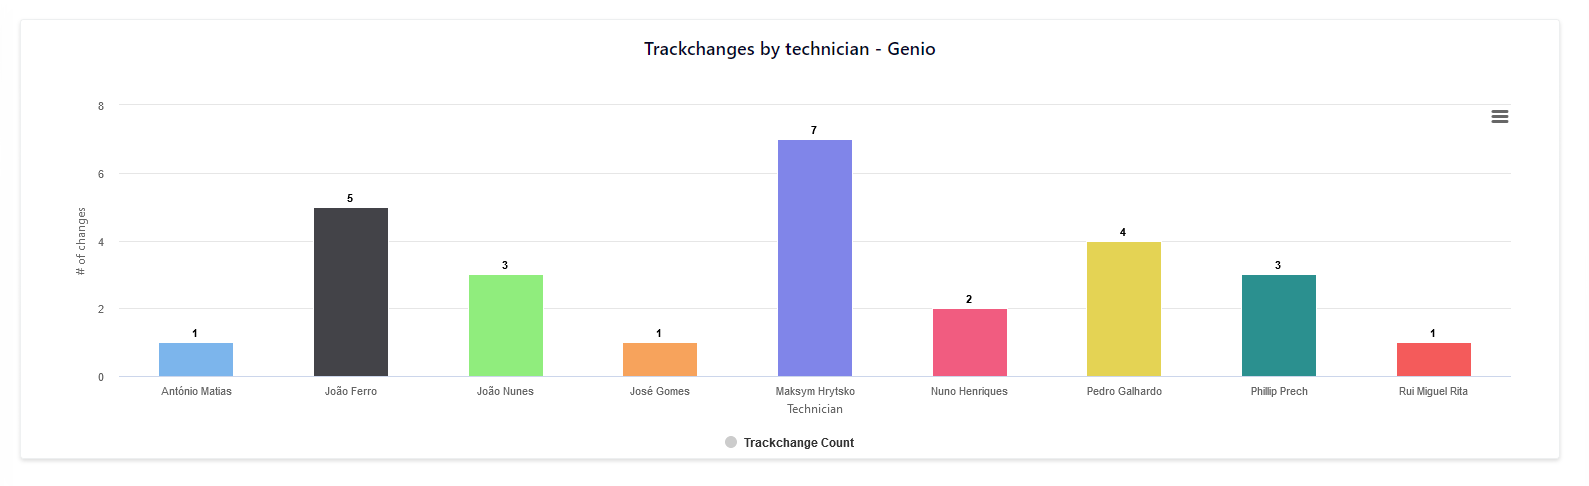
We break down the different patterns involved:
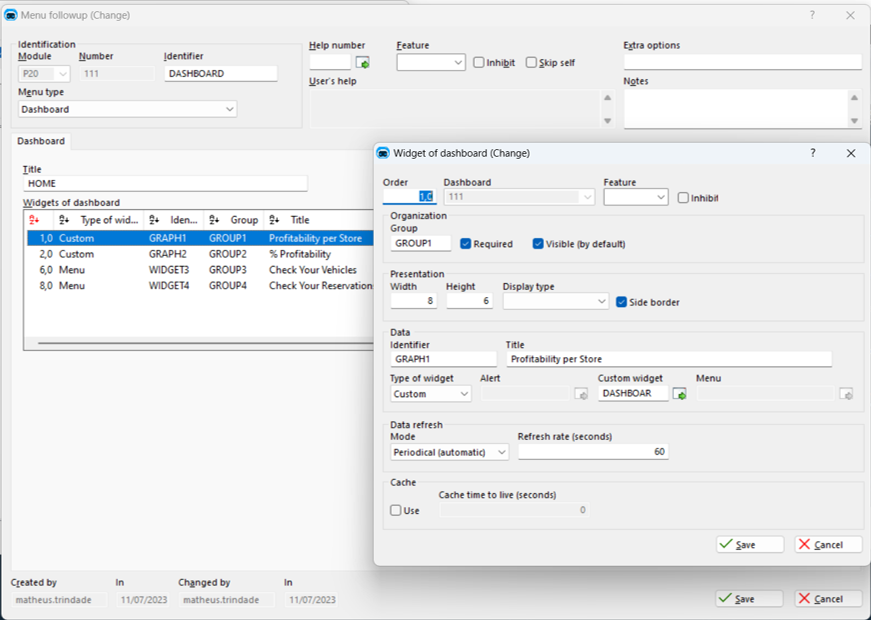
- The dashboard configuration contains a custom widget that points to a form of type "Widget"
- The "Widget" form contains only a table list
- The table list is configured to use the "Chart" visualization mode
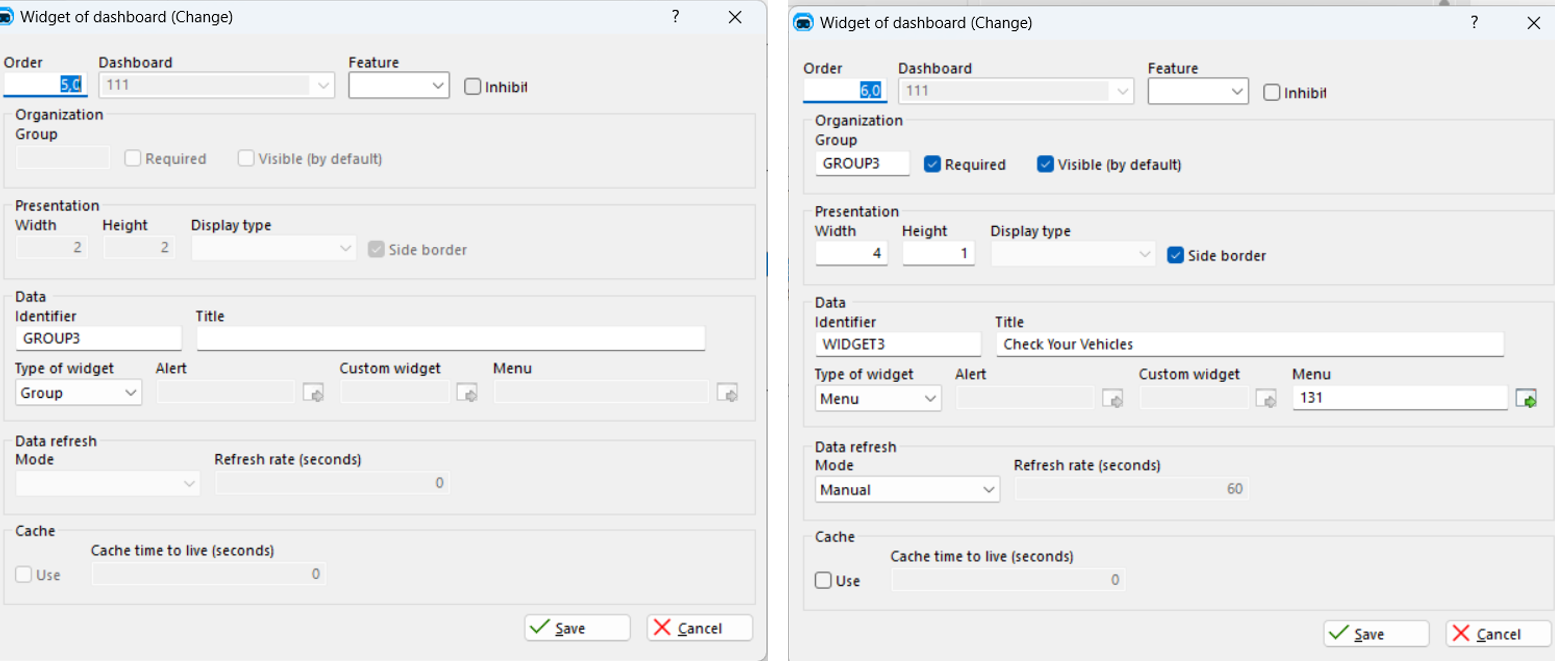
The following image illustrates the process of creating a favourite widget. Begin by creating a group for your widget in "Widgets Groups", as shown on the left image. Subsequently, insert a new widget in the "Widgets of Dashboard", select the "Menu" option under type and choose the corresponding menu to which the user will be directed.
Base area
As you might have noticed, the break down of the previous example mentions the use of a table list, which implies that the form is positioned on a given record.
This is possible because forms of the "Widget" type allow the base area of the form to be either empty or filled:
- If the base area is empty, the behavior is similar to an "empty form"
- If the base area is filled, the dashboard will provide one widget for each record of the form's base area. Appliable EPHs will filter the list of available widgets.
Title
It might be useful to use dynamic form titles when dealing with custom widgets. For example, if the base area is defined, the use of dynamic titles allows the user to differentiate the provided widgets.
Additional remarks
- When using forms that contain empty table lists (no records to display), the dashboard will automatically resize the widget to fit the table.
Properties
| Property | Description | Availability |
|---|---|---|
| Order | The default order of the widget | All widgets |
| Group | Defines the group of the widget in the widget panel | All widgets |
| Required | Defines whether the user may or may not remove the widget from the dashboard. Required widgets must be visible by default | All widgets |
| Visible (by default) | Defines whether the default is visible by default | All widgets |
| Width | The width (in units) of the widget | All widgets |
| Height | The height (in units) of the widget | All widgets |
| Side border | Defines whether the widget should display a side border | All widgets |
| Identifier | The unique identifier of the widget | All widgets |
| Title | The title of the widget | Alert widgets |
| Type of widget | The type of the widget | - |
| Alert | Speficies an alert to be source of data for alert widgets | Alert widgets |
| Custom widgets | Specifies the form to be rendered as the widget content | Custom widgets |
| Data refresh | The mechanism used to refresh the widget data | Alert and custom widgets |
| Refresh rate | The refresh rate of the widget. Appliable only if the data refresh is set to "Automatic (Periodic)" | Alert and custom widgets |
| Cache | Defines whether the widget data should be cached or not | Alert and custom widgets |
| Cache TTL | Specifies how long (in seconds) the cached data should be valid for | Alert and custom widgets |
Widget panel
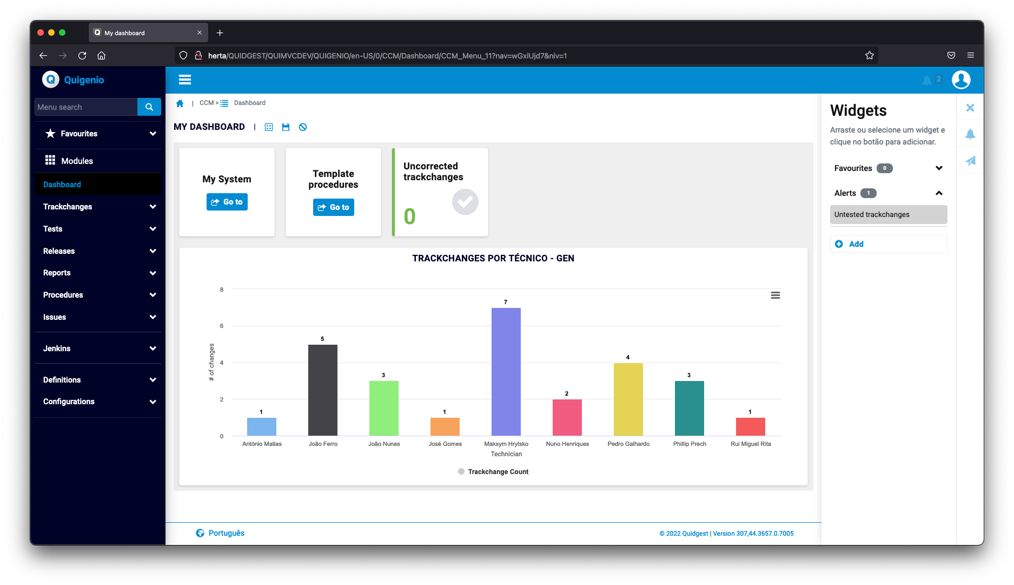
The widget panel is where the user can find the available widgets that have not been placed in the dashboard.
Widget groups
To improve the usability of the widget panel, widget groups can be defined. Their purpose is to bring collapsible sections to the widget panel, keeping it organized when many widgets are available.
Additional remarks
- All favourite widgets are automatically grouped in the widget panel. Creating a group for them will have no effect.
Configuring a dashboard
We break down the steps to configure a dashboard and its widgets, from start to finish.
Creating the dashboard
The dashboard pattern is currently available as a menu followup. To add a dashboard to your application, start by inserting it in the menu tree.
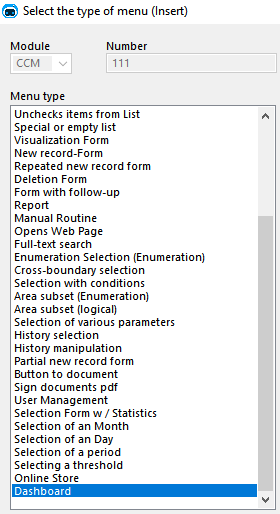
The dashboard entry will show up in the menu tree as a menu of type "DS".
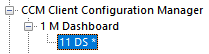
To start configuring the dashboard, open the newly created entry.
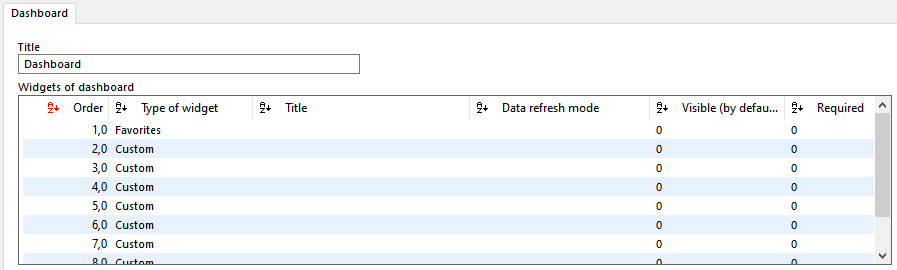
The title of the dashboard will generate a text resource, so it is translatable across the different languages of your application.
Adding the widgets
In the dashboard configuration, right-click the list of widgets and select "Insert" to add a new widget to the configuration.
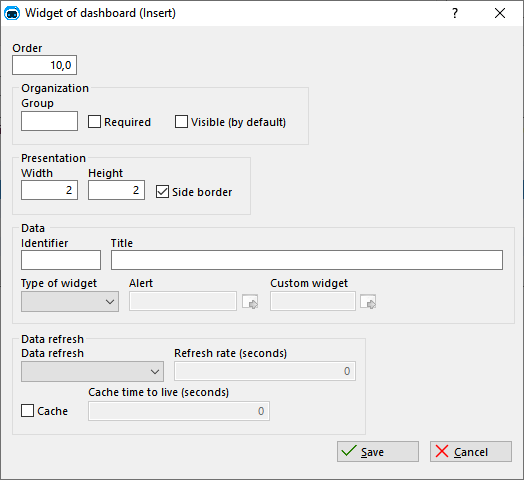
Configure the widget and click "Save".
To create a graphic widget, you must first create a form for this graphic. Proceed by inserting an unfiltered table list into it, as shown below:
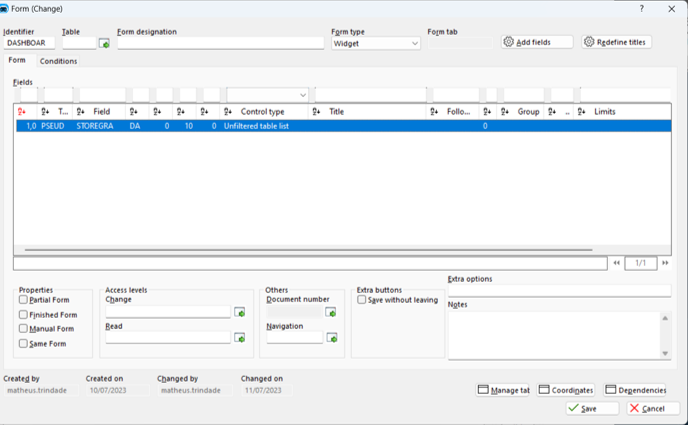
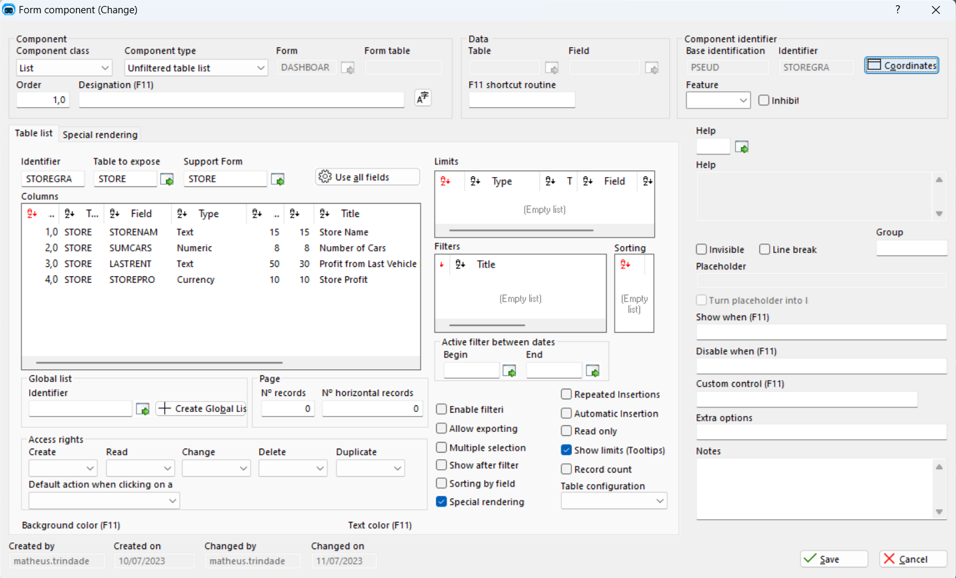
Select the appropriate table and form needed to assemble this list. Ensure to add all the necessary columns to it, since you will need that in the next step. Additionally, select the 'Visualization modes' feature.
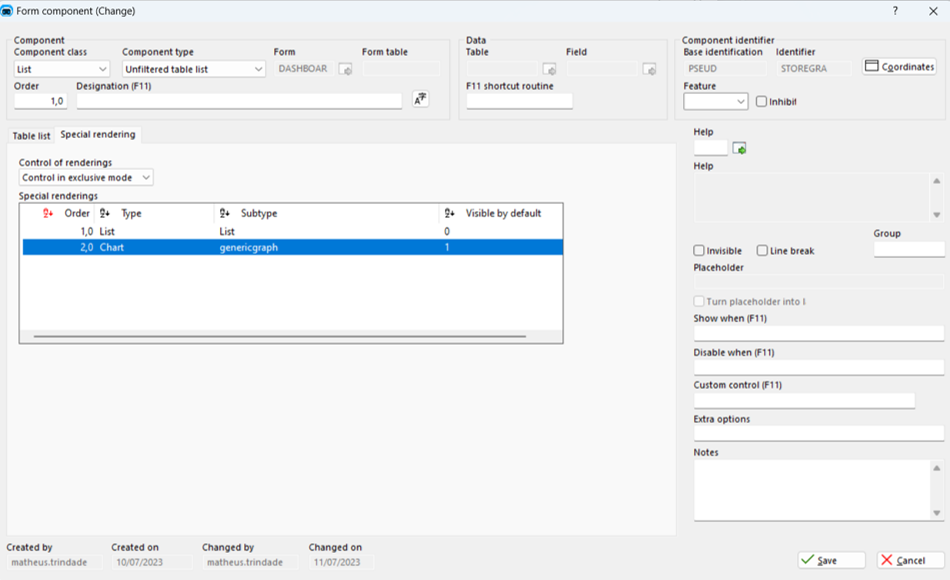
Within the 'Visualization modes' section of the form, insert a 'Chart' and choose a suitable subtype. In this example, a 'GenericGraph' has been implemented.
Access the 'Chart' you've created and populate the 'Variables' field with your chart's configurations. Depending on the chosen chart, these configurations might include details such as axis, axis name, graph title, and chart type, as shown below:
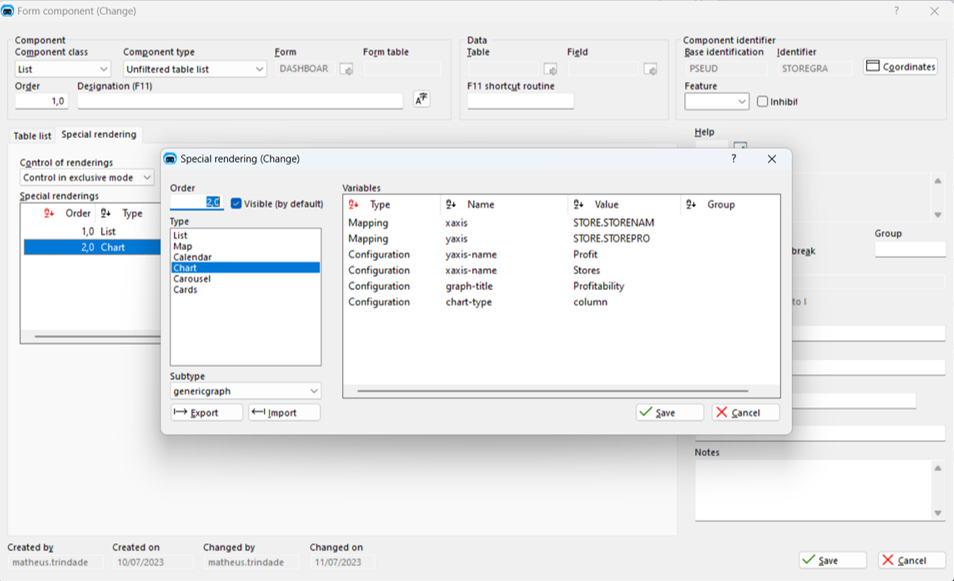
Once you've saved your form, navigate back to the menu tree where you initially inserted your 'DS' dashboard. Make sure that you create the group for your chart widget as described above, then proceed to insert a 'Custom' widget for your chart, selecting the form you just created, as demonstrated below:
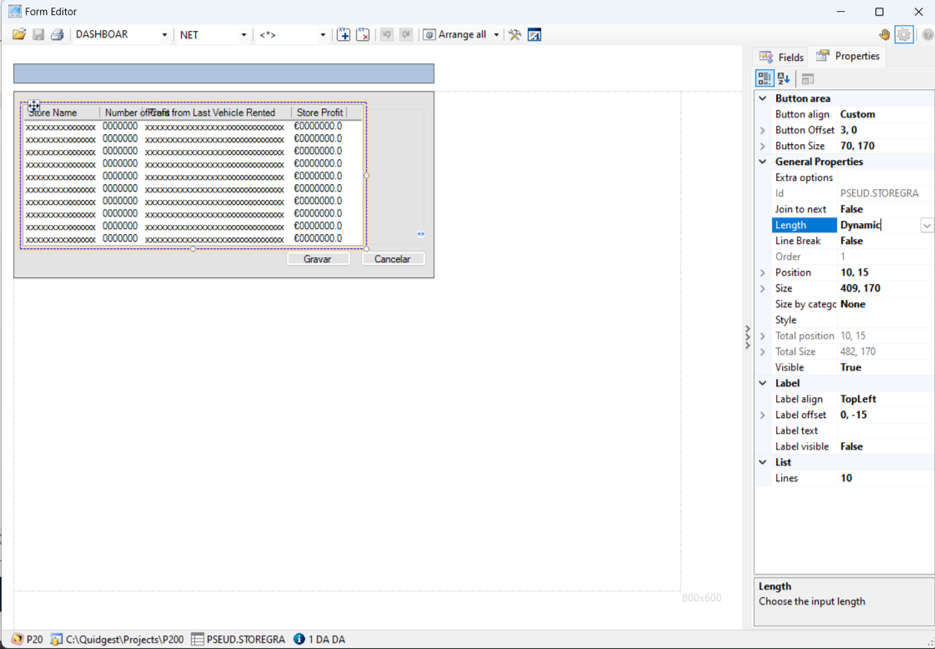
At last, ensure that your chart's length property is set to 'Dynamic'. Failing to do so may result in visualization issues within your application. Open your form editor and change the property, as follows:
Setting as home page
After the dashboard is configured, you might want to set it as the home page of its module. Start by inserting a new home page.
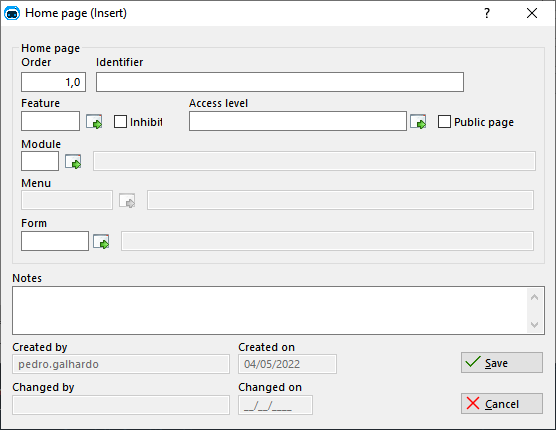
Add the dashboard by selecting its module and menu entry.
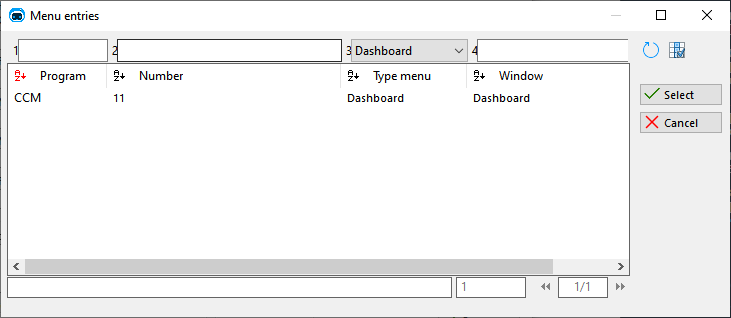
The dashboard will now automatically open as soon as the user opens its module.
Best Practices
Content and organization
- Plan before building. For each user role, list the three to five things users check every day. Those become the widgets visible by default.
- Offer more, show less. Build a larger set of widgets, show only the most important ones by default, and leave the rest optional in the widget panel.
- Put alerts and key indicators first in the widget order, so they appear at the top of the default layout.
- Keep related widgets together using the widget order, knowing users can move them at any time.
- Save users clicks. Add menu widgets for quick, repetitive tasks and custom widgets with recent records and direct links.
- Write short titles that say what is measured, such as "Overdue tasks" rather than "Tasks widget".
Alert widgets
- Show only alerts users can act on. A count nobody acts on becomes noise.
- Prefer personal alerts, such as "My overdue tasks", over global ones for operational users.
- Decide how each alert handles empty results: show zero or hide it.
- Make critical alerts Required so they cannot be removed.
Visual design
- Size each widget so its content fits, keep similar alerts the same width, and avoid odd sizes that leave gaps when users rearrange the dashboard.
- Choose the view mode that fits the content: a chart for trends or comparisons, a calendar for dates and deadlines, a list when users need to open individual records.
- Choose the chart type by purpose. The most used chart types are:
- Line for trends over time.
- Column to compare values across categories or periods.
- Bar when there are many categories or long labels.
- Pie for parts of a whole, with no more than four slices.
- Compare-series to compare several series side by side, such as this year against last year.